
Surprising Stats (Good News Edition)
Did you know . . . ?

I.
The middle class is shrinking! But don’t clutch your pearls and shriek in horror. It is a good thing as they are moving into the upper class. And before you try to counter with the obvious, the poor are getting richer too.
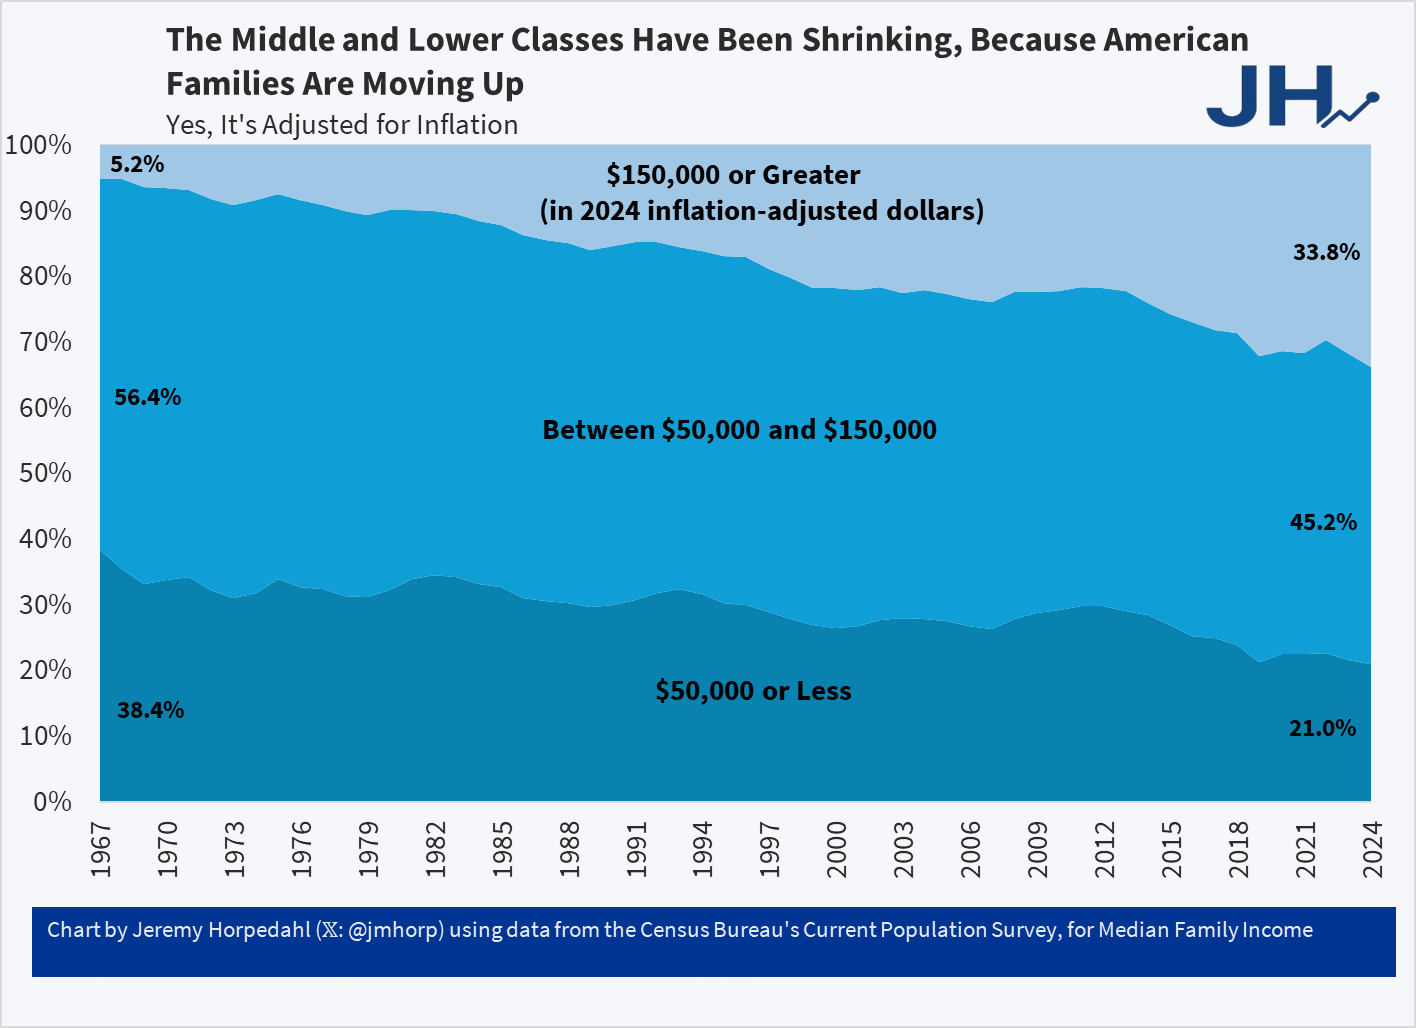
That graph is from Jeremy Horpedahl where as he notes in the subject line one-third of U.S. families earn over $150,000 [annually].
He followed up with another post digging deeper into the trends. In particular he wanted to address the question regarding if the rise in dual-income families explains the growth in family income. His answer:
In short: most of the growth of high-income families can not be explained by the rise of dual-income families. The basic reason is that the growth in dual-income families had mostly already occurred by the 1980s or 1990s (depending on the measure). So the tremendous growth since about 1990, when just about 15 percent of families were above $150,000 (in 2024 dollars), is better explained by rising prosperity, not a trick of more earners.
Kevin Erdmann, while agreeing with the general point of the original graph, does find something to challenge in the straightforward implication that the rising tide is lifting all the boats.
In a nutshell, this data is not fully adjusted for inflation. Or, rather, I should say, the adjustment is biased. The housing shortage creates rent inflation that is highly regressive, down to the neighborhood level. Go 5 miles in one direction to a neighborhood with residents earning more than $150,000 and go 5 miles in the other direction to a neighborhood with residents earning less than $50,000. It is likely that rents in the first neighborhood have risen along with general inflation and that rents in the second neighborhood have risen something like 40% more than general inflation since 2016.
II.
Back to the good news, Don Boudreaux elaborates on four ways you’re living better than ever. One of these is the surprising stat.
Supermarkets today carry many more items than they did in the past. Estimates vary, but supermarkets now carry roughly 32,000 different items (with some estimates being over 40,000 items, and some even as high as 50,000), while in 1975 the number was around 9,000.
There is more at the link certainly worth reading in full including this on life expectancy:
Life expectancy today is three percent longer than in 2000, five percent longer than in 1990, eight percent longer than in 1980, 12 percent longer than in 1970, and 13 percent longer than in 1960.
III.
Those stats on life expectancy might be surprising to you—especially if you pay much attention to the news media. That is because they tend to give A LOT of coverage to the sensational but unlikely causes of death while glossing over or ignoring totally the likely but unremarkable causes. Consider this graphic from Our World in Data as posted by Nathan Yau at FlowingData.
, lower respiratory diseases (6.3%), Alzheimer's disease (4.9%), diabetes (4.1%), and several other less common causes, including a very small percentage for homicide and terrorism.
On the right, three horizontal bar charts represent media coverage of these causes in three different publications: The New York Times, The Washington Post, and Fox News. Each outlet shows a percentage for heart disease, cancer, accidents, suicide, COVID-19, drug overdose, homicide, and terrorism. For instance, The New York Times reports heart disease at 2.8%, cancer at 4.1%, and accidents at 9.7%.
The accompanying note clarifies that data is based on the share of causes of death in the US and the corresponding mentions in the articles. The data sources include Media mentions from Media Cloud for the share of mentions, and mortality statistics from the US CDC and Global Terrorism Index.")
IV.
Finally, one potentially life-threatening ailment is in sharp decline: Peanut allergies in children. From the NYT:
In 2017, the National Institute of Allergy and Infectious Diseases formally recommended the early-introduction approach and issued national guidelines.
The new study, published Monday in the journal Pediatrics, found that food allergy rates in children under 3 fell after those guidelines were put into place — dropping to 0.93 percent between 2017 and 2020, from 1.46 percent between 2012 and 2015. That’s a 36 percent reduction in all food allergies, driven largely by a 43 percent drop in peanut allergies.