Let’s start with a couple friendly reminders that things are better around here than we might otherwise assume before turning to a one reminding us there is much work to be done.
I.
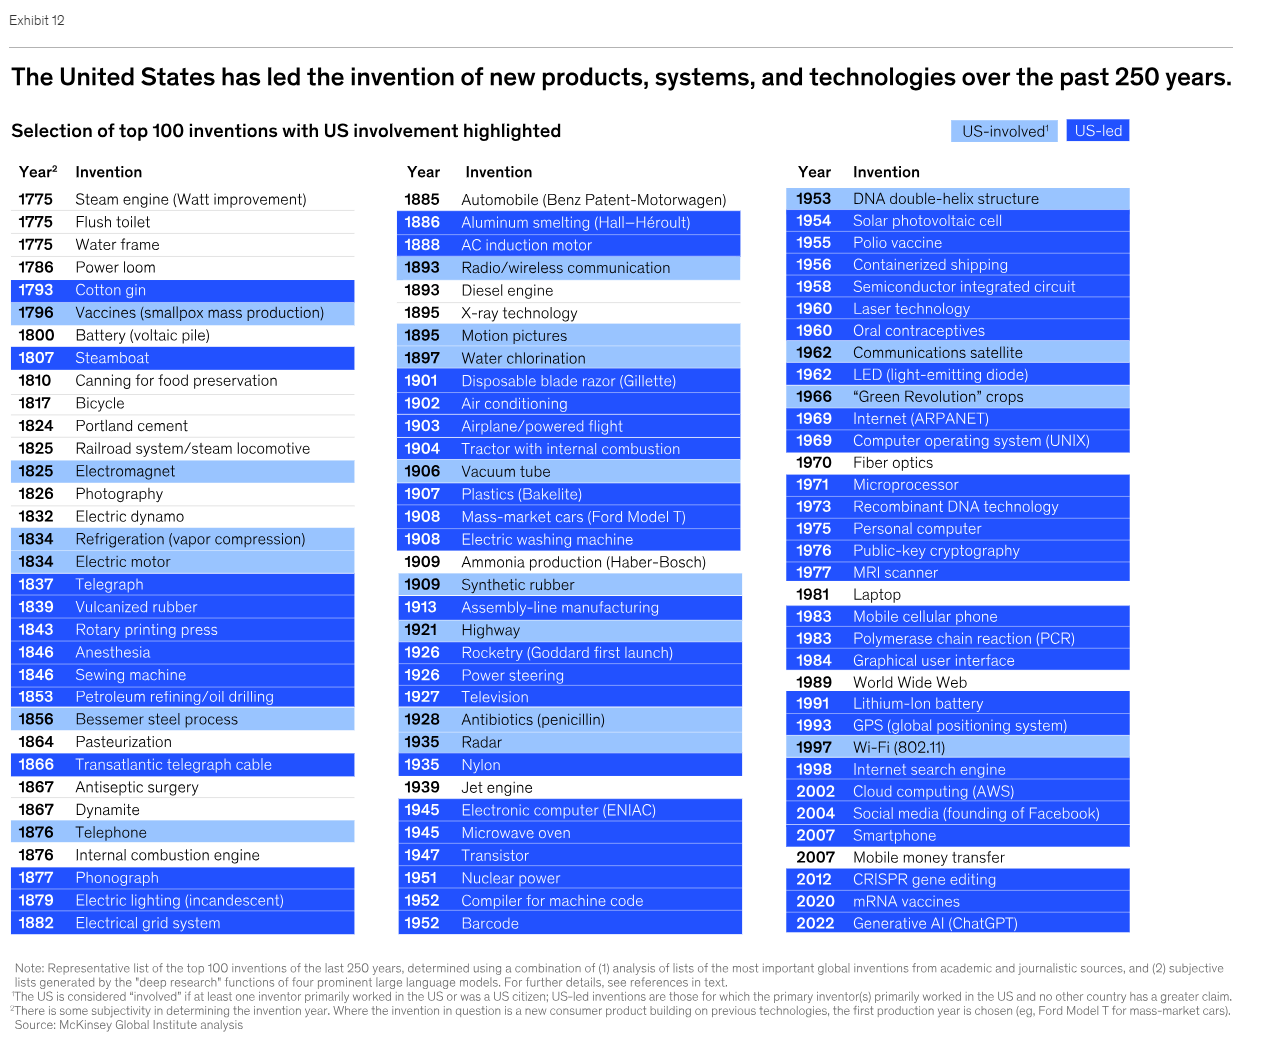
Here’s a proposed list of the top 100 technological innovations in products, systems, and technologies over the past 250 years. (I confess that I am a total sucker for mulling though lists like this.) The entries highlighted in dark blue were US-led; the entries in light blue were US-involved. In a broad sense, consider the dominance of US technological leadership since around 1900.
Another recent analysis published in The Economist finds that global inequality in consumption spending is falling. In 2000, the richest 10% of humanity spent 40 times more than the poorest 50%. In 2025, they spent around 18 times more. Using data from World Data Lab, they find that the poorest 50% now out-consume the richest 1%, breaking from past trends.
That one is from Chelsea Follett writing “A Reality Check on the Inequality Panic”. It is a short summary of how much better the world has gotten for the poorest relatively when compared to the wealthiest. By extension, the poorest enjoy a much better world today in absolute terms, which is what really matters.
III.
And now for the uglier news . . .
The economic costs of this complexity are enormous. For starters, there’s simply the time and money we have to spend complying with an ever-growing and always-changing tax system. According to the Tax Foundation, compliance with the federal tax code cost Americans roughly $536 billion in 2024–2025—or nearly 1.7 percent of 2025 gross domestic product. They conservatively derive this number from two sources: First, there’s $148 billion in out-of-pocket costs for software, tax preparers, and accountants. Second, there’s time: Using a reasonable hourly wage, the 7.1 billion hours Americans spent complying with the tax code translates to roughly $388 billion in lost productivity.
To put these figures in context, $536 billion is more than the corporate income tax will generate this year, around twice as much as Trump’s tariffs will raise, and more than 43 times the IRS budget. The 7.1 billion hours spent complying, meanwhile, is the equivalent to 3.4 million full-time American workers—almost the population of Los Angeles—doing nothing but tax paperwork for a full year. The National Taxpayers Union puts the total compliance burden at $464 billion for 2024, with the average filer spending 13 hours and $290 just to pay his taxes. For many Americans (including me—sigh), tax filing demands multiple spring weekends doing unpaid labor just so we can cut the government another check. (Yes, I am bitter.)
That is from Scott Lincicome reporting on how much Tax Day cost Americans besides what they paid in taxes. Sadly unsurprising to me, and yet we don’t have the political will to change it. I’m bitter too, Scott.
Magnitude Matters is a reader-supported publication. To receive new posts and support my work, consider becoming a free or paid subscriber.