
The Threat To The Greatest Streak In Sports History
The risk today to a part of Bud Wilkinson's legacy

Winning in sports is everything despite what you’ve been told. How we define winning is the key—and perhaps a subject for another post.
There is one example in this regard I would like to discuss. In all of sports history it is hard to find a team that truly won while winning any better than did Coach Bud Wilkinson’s Sooners. From all accounts he was a gentleman coach who conducted himself with honor and respect. And he taught that to all his players. If there was anyone who won the right way, it was Bud.
Among all his accomplishments, the one most remembered is the record-setting 47 straight wins, which stands to this day 66 years later.
Is it still relevant? Well, certainly yes in some respects and certainly no in others. The game of football has changed remarkably over the decades. Beyond style and strategy, the three most critical developments have been (1) racial integration in the sport (Bud’s notable, age-defying inclusion of a black player, Prentice Gautt, notwithstanding), (2) change from one-platoon to two-platoon football/substitutions, and (3) general development of athletes and equipment in general.
With all of the changes including the recent developments of super conferences and the college football playoffs, a question arises: Is the 47-game winning streak easier to eclipse today than ever before?
Some things to consider:
Today teams play considerably more games in a given season. The regular season in the 1950s was 10 games plus an occasional bowl game. (Oklahoma was in the Big 7 conference during the streak. The conference at that time prohibited a team from attending a bowl game two years in a row. This potentially helped or hurt OU in that they avoided a potential loss in a meaningless game—national champions were determined before the bowl games—yet they might have won yet two more games in the bowls games they did not get to play in.) Today teams play 12 regular season games plus in most cases a conference title game plus either a single bowl game or two games in the playoffs (very likely for a team challenging the streak).
The college football playoffs are expanding in 2024 to 12 teams meaning some teams could play 4 “bowl” games while two will play at least 3 (the top four teams get a first-round bye meaning eight teams play, the winning four play those that got a bye, the winning two then play the championship). This allows for 3 or 4 more wins for the champion beyond the 12 regular season games plus the conference title (if there is such a game in that team’s conference). Thus today a team can win 15 or 16 games in a single season where in the 1950s that was limited to 10, 11, or 12.
Today’s superconferences are comprised of more talented, challenging teams. Not only would a 47-streak challenger have to catch fire within itself; it would likely have to be a bit lucky to not have on its schedule very much of the best competition within its own conference. This is harder to assume today. And keep in mind one of those strong competitors is likely to be faced in the conference title game.
There is considerably less volatility and unknowns in the sport today than in the 1950s. This probably means it is easier for a dominant team today to win against a rogue opponent. This might seem counterintuitive, but it stands to reason. Volatility, randomness, and deviation from normalcy is the enemy of expected outcome. There is a good reason team’s like Missouri used to grow their field’s grass out long and sand the field when Switzer’s wishbone-running Sooners came to town. They wanted to slow down the game. Same for how Army and Iowa State, et al. played Riley’s Sooners. The Taft Rockets desperately needed a miracle, which they got when it started raining.
The essential consideration is the relative amount of competition a team must face over the course of +47 straight games. It is hard to continue to be an elite team over many seasons, but it is also hard to continue to win when facing more difficult competition in any given season.
To recap: the 47-game streak was over 5 seasons (1953-1957). Today a team eclipsing it could play enough games within 3 seasons (winning 16+16+16). Another route would be win say the last 9 games one year, 15 each of the next two years, and win the first 9 games the fourth year. Obviously there are lots of 4-year combinations.
Competition is harder today in the shortened timeframe, but it just takes a little reloading of a great team because of the shorter timeframe. Sorting this out calls for a model. So here goes . . .
In the model snapshot below I compare two versions of a streak challenge. The upper portion is the first version. Call this the shortest route possible—fewest seasons. I then make assumptions about how many difficult teams an Elite+ team will face where an Elite+ team is a team in contention for the streak (best of the best, so to speak).
In the lower portion I consider if a team were to accomplish the feat over additional seasons, which would mean fewer perfect seasons.
In both cases the left-hand side is the “current world” meaning teams today and the right-hand side is the “old world” meaning teams of Wilkinson’s era.
For simplicity I built the upper portion to be 12-game seasons even though these were rare at the time.
The results surprised me. I came into this thinking that it would be meaningfully easier to defeat the streak today than in the past. Yet for what it’s worth, the model shows the opposite to be the case in one version (lower) and only a bit easier in the other (upper).
To be sure magnitude matters in that the differences are large in terms of percentage change/comparison but the baseline chances are very small—in the model’s upper portion it is 28% less difficult in the new world but there is still only a 0.0023% chance of it happening in that world. Even if the chances had gone up to the tune of say doubling, that doesn’t amount to much. In other words we can double the chances of an extremely unlikely thing and the chances are still extremely unlikely—remember this when the media tells you “a new study shows the risk of cancer DOUBLES!!! from [eating this, not eating that, exposure to something, lack of exposure to something else, etc.]”. Double of zilch is still zilch.
Another thing the model does not capture is the implication of many, on-going trials. This model shows the chances of any one Elite+ team beating the streak in a given period. It is not the probability of any Elite+ team ever beating the streak. Think of the difference between flipping a quarter 10 times in a row and each time the result is “heads” versus flipping a quarter 10,000 times and within that larger set getting a 10-in-a-row “heads” result. The chances that any team ever does it is going to be low but much, much higher than the figures show. Still since we’ve had many chances over the past two decades for a team to beat the streak and it hasn’t happened (or even come very close), I am tempted to believe I am underestimating how difficult it is today.
One potential point of consideration would be how in a given season a team facing more and more games as they do today might make the competition more difficult than it would otherwise be. Think of it as a wearing down effect where the Elite+ team doesn’t get a chance to recuperate—everything from catching its breath to getting injured players healthy.
Although other teams face this as well, this probably pushes back a little on my contention that there is less volatility today. It might be easier to reload in an offseason and have an additional season to be Elite+ than it would be to maintain Elite+ status over a longer season. However, I don’t think seasons are long enough even at 16 games for this to be a critical factor. To adjust for this in the model I think one would simply make the mix of teams marginally stronger in the new world or alternatively increase the probability of continuing to be Elite+ higher in the old world. Since I am looking for ways to make it easier for a team to eclipse the 47-game streak, this isn’t a central concern for me.
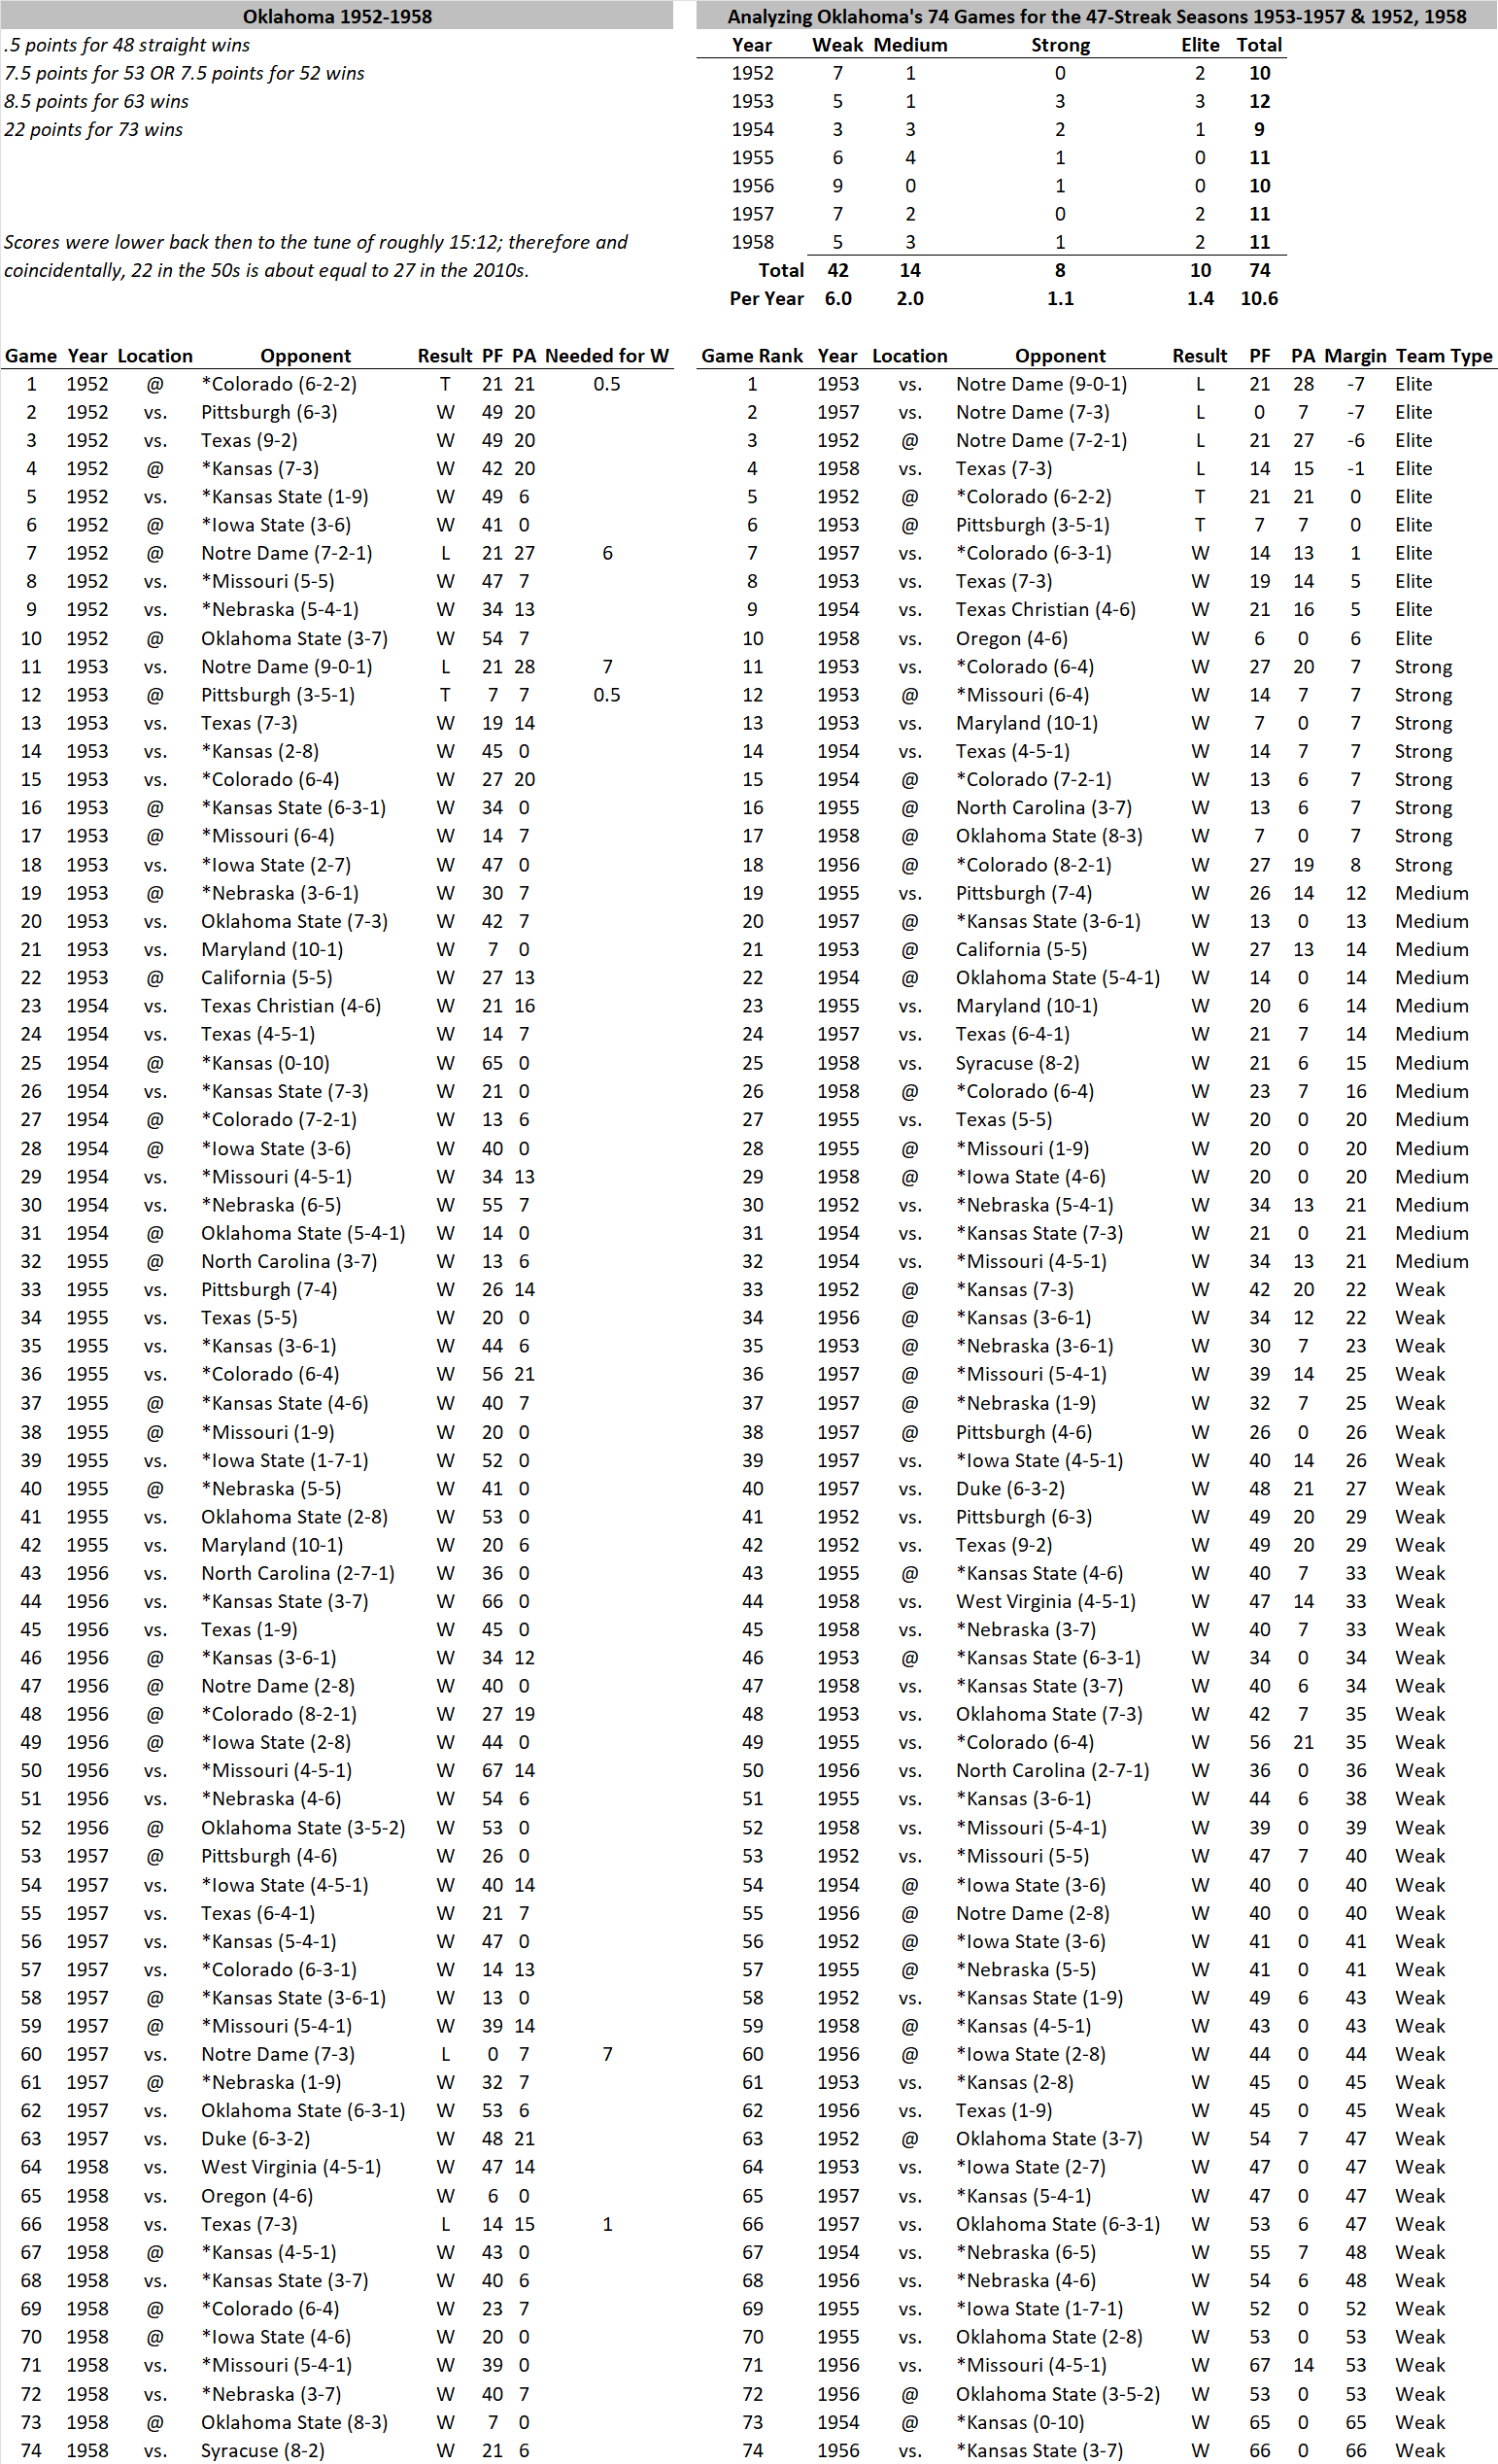
As an attempt to reality check the model and generally see what teams have come how close recently to beating the streak, I share the following analysis with commentary after the snapshots. Note that I very roughly approximate for team type (weak, medium, strong, and elite) by ranking based solely on the margin of victory for the team under examination.

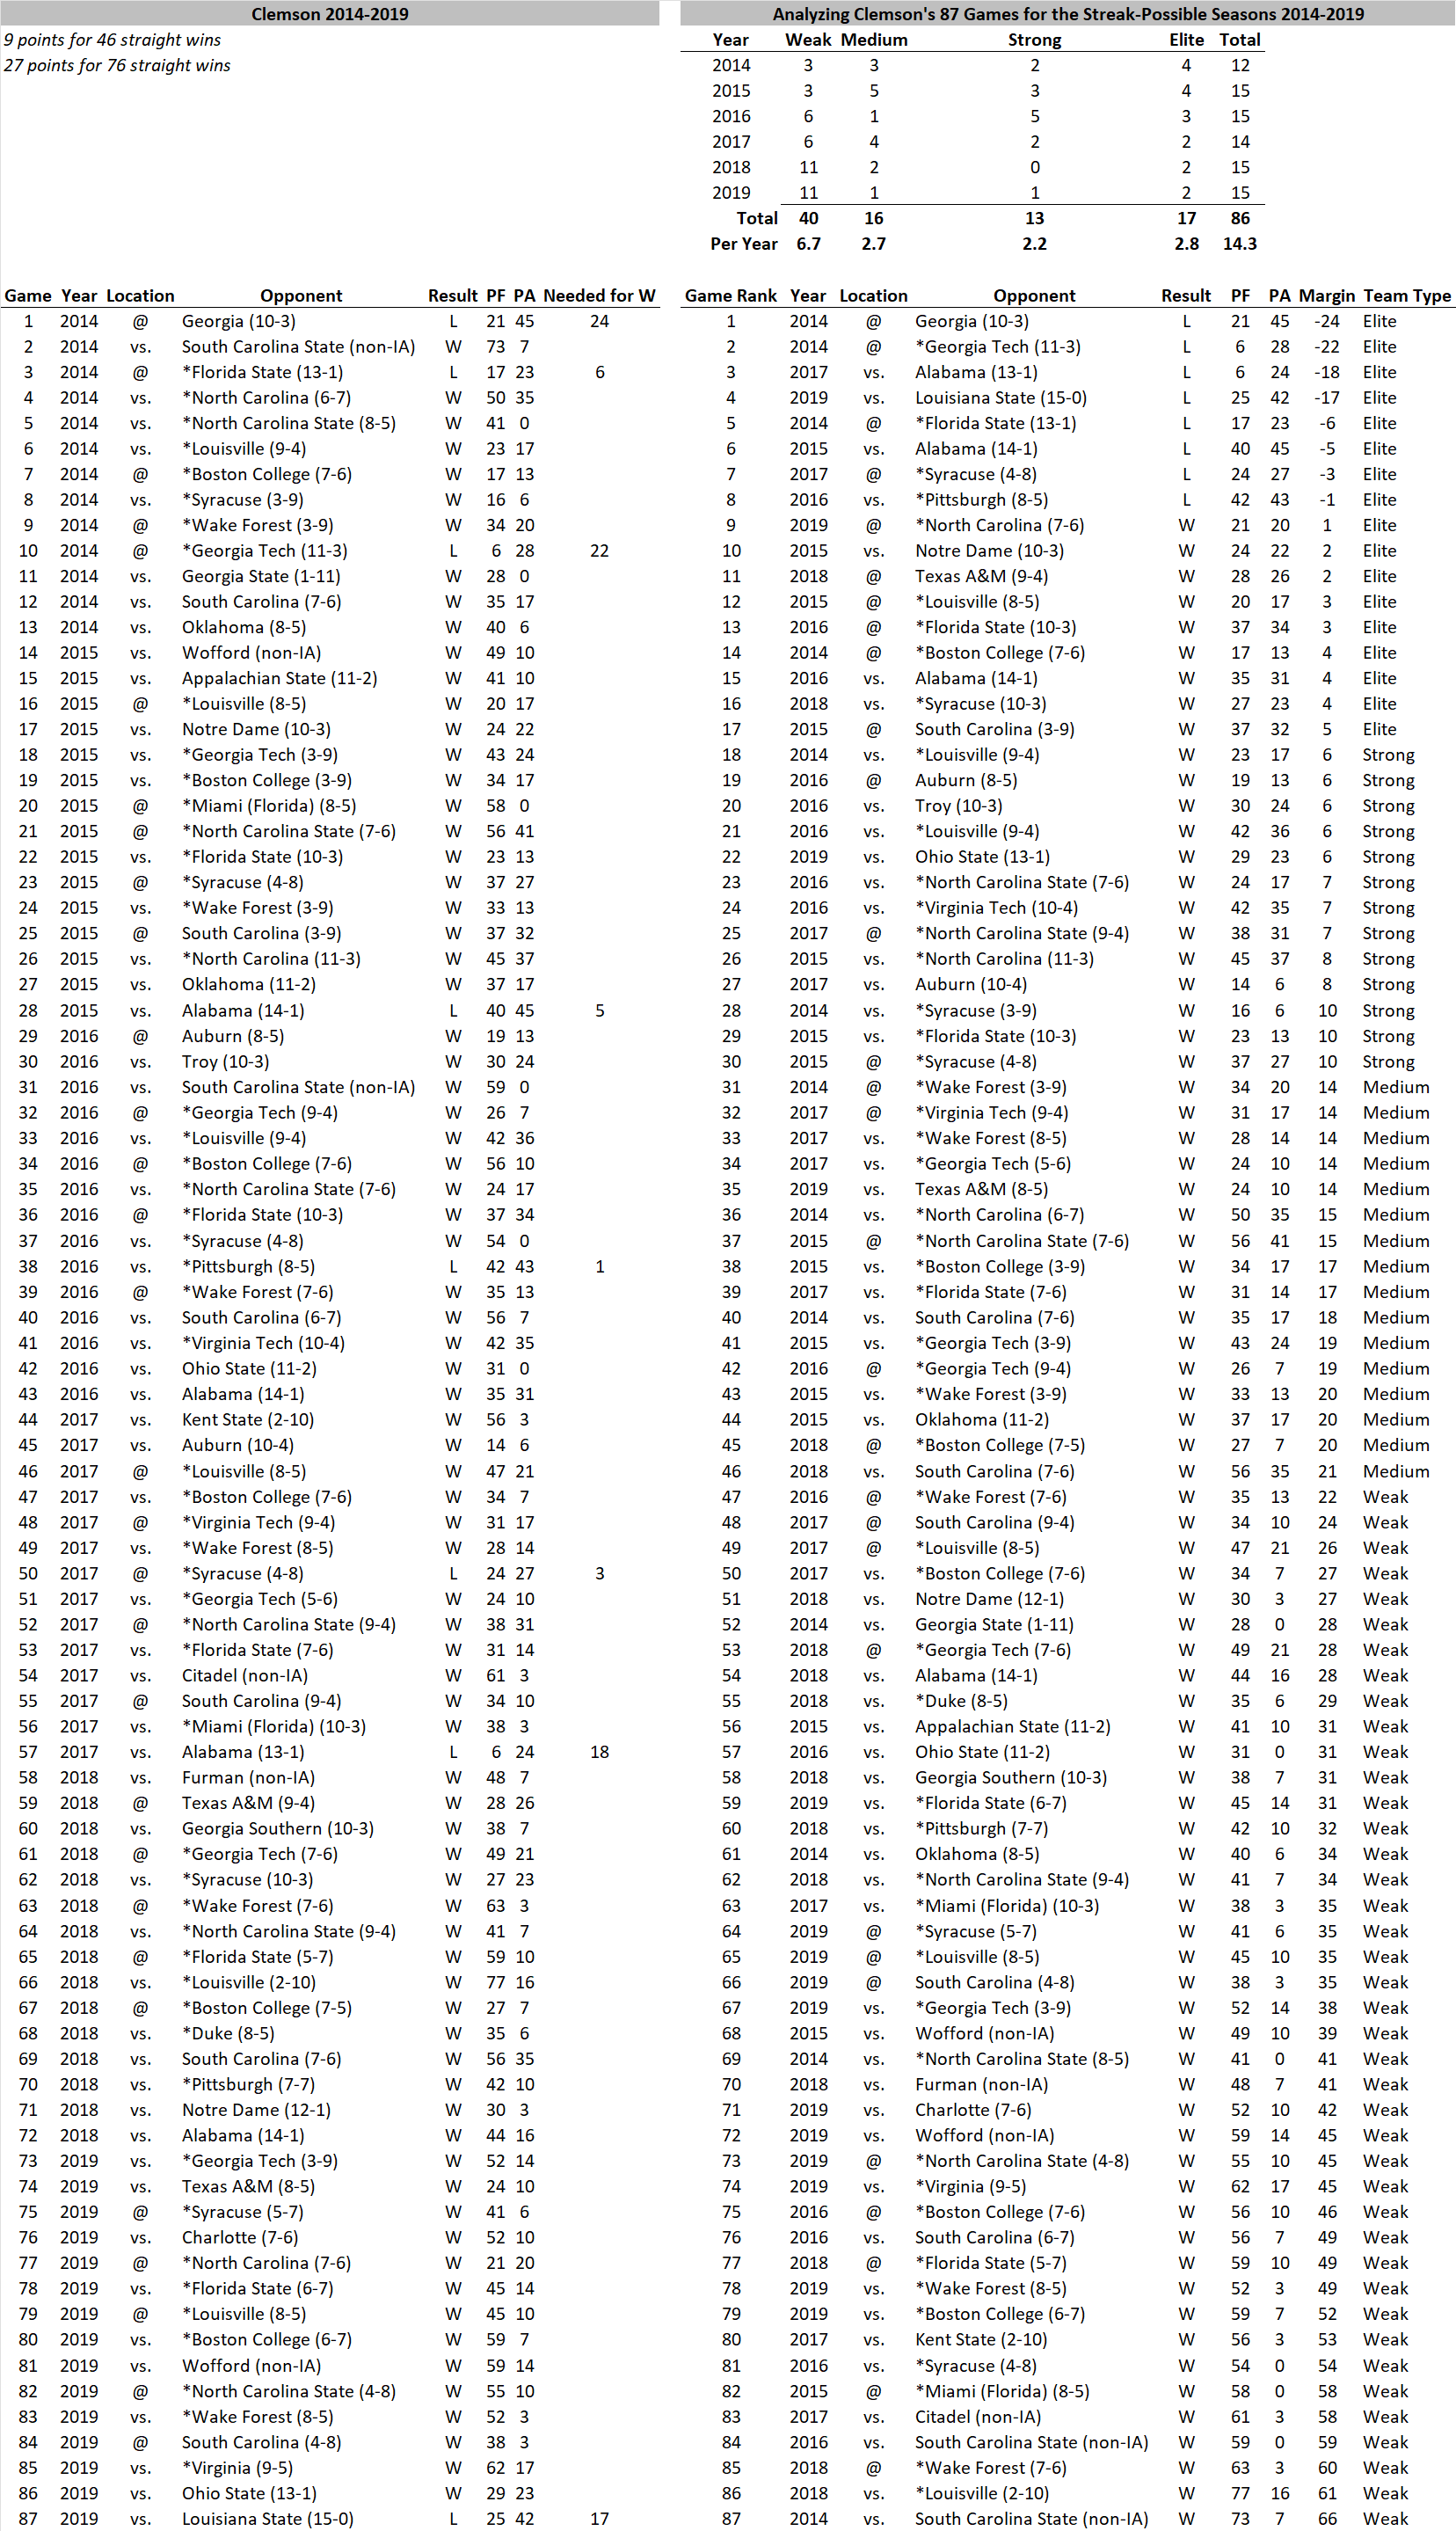


In an era between the ones I am modeling, several teams made runs at the streak—notably Toledo 1969-1971, Texas 1968-1970, Nebraska 1969-1972, and Miami 2000-2002. In the current world, I examine four teams who have come kinda close: Boise State 2008-2011, Clemson 2014-2019, Alabama 2014-2022, and Georgia 2020-2022 (still on going).
Of these Boise State is by far the closest. They came within four points total across three games of hitting 48 straight. While this makes sense in that they played and still play in a lower level of competition than the truly Elite+ teams, this is probably a bygone situation. Today they would find themselves in the playoffs facing more bracing competition. I don’t think the model applies to Boise State of that era, but that era is over.
Clemson doesn’t quite get there with nine total points across three games keeping them from 46 straight. But just one more game, albeit with another 18 points needed to win, gives them 76 straight wins. So Clemson is 27 points total over four games of achieving a colossal feat. Remember these figures for the discussion of Oklahoma below.
Alabama had the longest run (still active I might add) of challenge. But the closest they come is 17 points across three games to get to 50 wins.
Georgia has been great of late, but they are far short so far. To make their current streak just 40 wins, they would require 50 points to win an additional three games.
In all cases of these recent teams we must note that an additional win in many cases would propel the team into the playoffs, which cannot be seen in the analysis as those games against elite competition did not occur.
To be fair to Oklahoma, OU would have needed just half a point to get an additional win (the two games before the streak were a loss to Notre Dame followed by a tie to Pittsburgh). Giving them 7.5 points on either side of the streak would extend it to either 53 or 52 straight wins. Distributing 22 additional points across six games extends the streak to 73 wins. Note that scores were lower back then to the tune of about 1.25 points then equals 1 point today. Therefore, 22 points then is about equal to about 27 points today.
The relevant spreadsheets are available for any who might wish to play with the model, examine the data, or otherwise double check my work.
Select historical team analysis
Thanks to James Howell for making the data available online from which my historical analysis is derived.