
Was the CAPE *Not* Too Damn High?
How about now?

Astute market analysts know you have to look beyond the more naive metrics like PE (Price-to-Earnings) ratio to more nuanced ones like the CAPE ratio (Cyclically-Adjusted Price-to-Earnings; aka, Shiller CAPE) for deeper insight into market valuation.
For the purposes of this post, the market to which I am referring is the S&P 500 Index of the U.S. stock market, which is what the Shiller CAPE was constructed for.
PE ratios have obvious shortcomings. Those based on 12-month forward earnings are subject to the wishful guesswork of analysts who are notoriously wrong. Those based on 12-month prior earnings are subject to the known volatility of earnings over such short periods.
Shiller’s CAPE was designed to mitigate these problems by getting a longer-run lookback at earnings (prior ten years) smoothed out for inflation (real earnings).
What it tells us and how it has changed.
The CAPE has proven to be a much better predictor of long-run future returns while still being a very bad method of investment timing. To wit: It tells us a lot about the future while telling us little about how we’ll get there.
For those who don’t know, owning a stock means owning (part of) a company. Owning a company means being entitled to the profits of that company. The value of that ownership is (in the long run) simply the value of that stream of future profits. Since we don’t know the future, we then have to settle for the expected value of those profits (aka, earnings).
Prior earnings provide insight into future earnings. When coupled with good assumptions about the possible future (ranges of outcomes with various probabilities), we can make reasonable predictions about future earnings.
The CAPE gives us a decent tool to use simplifying this type of analysis. When the CAPE is relatively high, it implies future returns are relatively low—a high CAPE means high valuation, which means higher expectations about the future. If the future is more like the past than those expectations are implying, then those elevated expectations must be somewhat incorrect. If the future is different than the past such that the future is better, then those elevated expectations might be more appropriate than a naive reading of the CAPE would imply. In other words, the world can (and does) change.
There are several big ways the world likely has changed over the past 150 years (Shiller’s CAPE has been calculated back to 1871!). The first is that our appetite for risk has changed beyond drifting up and down from time to time. The second is that risk in the world itself has changed (again, beyond times being riskier/less risky during different eras). Add to that the growth in scope and scale of capital markets as well as a host of other structural changes. Be careful when considering these changes, though. The world is a lot more like it always was than it is different. There is a very big graveyard full of portfolios that inappropriately relied on the assumption this time is different.
Still, I do believe and I think many agree that the average CAPE that prevailed before what I might call the modern era of equity investing is somewhat inappropriately low for what has prevailed and should be considered appropriate in this modern era. In other words, a good estimate of an appropriate CAPE is higher today than it was in the early part of the 20th century. When that transition should be placed is probably a fool’s errand as is getting too precise about how much it has increased.1
Was the CAPE too high ten years ago?
As I said above, the CAPE provides insight into future returns with fairly good reliability and virtually no specific predictability. Since 1985, the relationship between the level of the CAPE and the next ten years’ total return of the S&P 500 has been pretty tight with an r-squared of .77, which means 77% of the variance in returns is accounted for by the variance in the CAPE. The relationship has been negative, of course, with a high CAPE associated with lower returns and a low CAPE associated with higher returns.
The specific regression results I derived using monthly data in keeping with Shiller’s work and relying on the website Multpl yields the equation:
So a CAPE of 10 would imply a future expected return of about 15.6% per year. A CAPE of 20 would imply a future expected return of about 9.8% per year.
Of course, basically it doesn’t ever match the regression’s expectation. In January 1985 the CAPE was 10 but the actual return over the next ten years was only 10.16% per year. In January 1993 the CAPE was 20.32 while the following decade’s return was 6.89% per year. A year and a half later in July 1994 the CAPE was 20.07 and the next decade’s return per year was 8.57%—much closer to the estimate we have today for such a CAPE reading keeping in mind that model above covers the period 1985 through June 2026. Even with these deviations (perhaps more difference than the model’s predictions than would a naive onlooker expect), the fit is tight.
In June 2016 (ten years ago) the CAPE stood at 25.84. The future return would have been predicted using my dataset that includes the ten years following June 2016 to be 6.44%. What was it actually? Drumroll . . . 11.92%!
This comparison hints at the larger point of this post. IF we knew the future, would the CAPE become more reasonable as a predictor of future returns? Or restated: Is the market efficient enough that we should expect it knows something the simple CAPE metric and it’s historical implications don’t know?
Robert Shiller won the Noble Prize in economics in 2013 in large part for his creation of CAPE and much of his body of work has been pushing back against the concept of efficient markets. So this exploration comes with a good deal of irony.
A reading of the CAPE in 2016 said to expect below-average returns or require above-average earnings. Well, we actually got above average earnings, as I’ll show below, making the CAPE fairly reasonable in 2016. I’ll define fairly reasonable as well.
What should the CAPE be?
One of the big mistakes made by investment professionals when using the CAPE is to assume what it should be and then make sweeping predictions about what’s to come. At times this includes me.
The CAPE is a metric. When that metric is interpreted and employed, it becomes a model embedded assumptions. One assumption is that the future will be like the past. As we’ve covered above, there is reason to suspect it will be and reasons to expect it will not. Remember “All models are wrong, but some are useful.”2
If forced to make a prediction about the S&P 500’s next ten-years’ return back 2016, I would have pointed to the CAPE and guessed “about 6% per year on average”. That would have been fair but incomplete. What should have been added in this (not quite) hypothetical is “either that or earnings will have to increase a lot to make this CAPE reasonable”.
Real (inflation-adjusted) earnings grew at an average annual rate of 5.35% over the past 40 years. For the period 1987 to June 2016, they did slightly better growing at an average rate of 5.59% per year. Growing at that rate for the next ten years would not have been enough to change the CAPE from its backward-looking position (price in June 2016 divided by average real earnings over the prior ten years) of 25.84 to something . . . reasonable. There’s that word again, I better define it.
The CAPE over its entire history (1871 through 2026) has averaged about 16. Remember from above that I think it should be higher in this “modern era” than it was before. Maybe it should be 20 (“20 is the new CAPE 16”). Who knows? We’ll come back to that in a bit, but let’s just assume a reasonable CAPE is still (or was in 2016) 16. Buckle up . . .
Efficient Market Hypothesis for the win!
If we knew the real earnings over the next ten years, we would know in 2016 (ten years ago) what the CAPE actually was (price in 2016 divided by future real earnings over the next ten years). Guess what? The CAPE using actual ten-year-forward real earnings was 15.4!!! Quite reasonable by anyone’s standard. The market is Mr. Zero; don’t [mess with] Mr. Zero. Turns out Mr. Zero knew.
Rather than growing at the prior average of 5% and change, real earnings grew over the ten-year period June 2016 through May 2026 at an average annual rate of 11.2% (188.8% in total).
No, I am not going to claim this level of market efficiency, which would be beyond what is meant by the EMH extending to something absurd. Yet it does indicate that the market was telling us something by pricing a CAPE at 25.84—something our model that uses CAPE wasn’t appreciating.
And if the modern era normal/appropriate CAPE is more like 20, then the market was underpricing the value of the S&P 500 in June 2016 at a CAPE of 25.84.
Another way of looking at it is through expected versus realized total return. As we saw above, CAPE of 25.84 implies a future annualized return of about 6.4% using the regression history. A CAPE of 16 implies a future annualized return of about 12%. The actual return from June 2016 through the other day (June 9, 2026) was a whopping 15.4% per year. Part of this difference is the actual, above-normal growth in real earnings we experienced in that ten-year period. Part of it was a continued source of future optimism in the growth of earnings. Which brings us forward in time a little . . .
EMH should have taken the W, and walked away.
As you may know (or suspect), the CAPE didn’t allow earnings growth to let it trend back down to something “reasonable”. It kept marching upward. Today it stands a little above 41. Back in June 2021 (five years ago and five years into the period we’ve been examining) it stood at 36.7.
I’ll do the math. That is an implied return of 0.14% per year over the next ten years (five of which we’ve already seen). The actual return over the last five years has been . . . wait for it . . . over 13% per year. So back to making predictions based on the CAPE model, that means either returns will be very low (negative) over the next five years (to get us to a reasonable forward-real-earnings CAPE) or earnings will need to grow a lot more. How much is a lot?
Real earnings grew 79% from June 2021 to May 2026 (the first five years). To have the CAPE become an implied 20.31 as of June 2021, real earnings will have to grow in total 30% over the next five years (5.35% per year) with no change in price. Real earnings have grown on average 5.35% per year over the past 40 years. Keep in mind this is just to make the CAPE in June 2021 be a reasonable figure assuming one knew the future of real earnings growth.
It is getting harder and harder to sustain the CAPE at such levels simply because it implies real earnings growth continuing at a pace that challenges (to say the least) what is theoretically possible.
Today the CAPE is about 41. This table shows the future growth in real earnings that bring that down to various levels. Keep in mind this means no change in price—a 0% nominal return (negative real return).
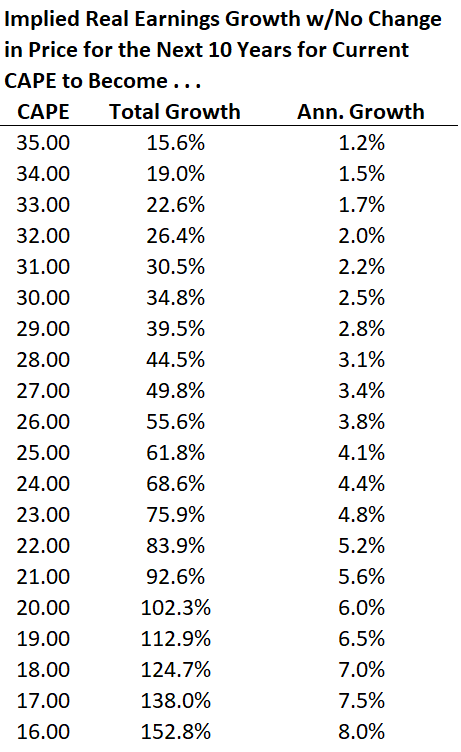
These all seem like “reasonable” growth rates for real earnings, but they imply very unacceptable returns—unreasonable from the standpoint of what investors expect/require.
To get the CAPE down to 20 (much less 16), investors will need to have real earnings exceed long-run historical growth and sit patiently while the price of their investment goes nowhere. Or maybe future earnings (the next ten years) will keep pace with the recent period and future-future earnings (the period beyond that) will carry a similarly optimistic outlook. We’ll see . . . .
Without being that fool on an errand, a point of reference would be that before 1980 the average CAPE was 14.89. Since 1980 it has been 23.84. That is about a 60% increase. Play with the start date of the modern era as you might, you’ll always see an increase. It seems to be anywhere from about 30% to about 60%. I have no strong feeling about how much it has increased—only that it has increased meaningfully.
Coined by the British statistician George E. P. Box in 1976.
Terrific analysis. I had not seen before such a good numerical connection between future earnings growth and justification for CAPE.
Given currently historically high profit margins, investors should cheer 5-6% real profit growth.
Thank you!