Immigrants reduced deficits by $14.5 trillion since 1994.
That’s trillion with a “T”!
The quote above and excerpts below come from the Cato Institute’s latest study “Immigrants’ Recent Effects on Government Budgets: 1994–2023”. It contains a wealth of analysis many will find surprising as well as quite counter to conventional wisdom. And the gravity of it is of a massive magnitude—hitting triple themes here at MM.
David Bier is one of the authors. His recent post summarizes the findings well.
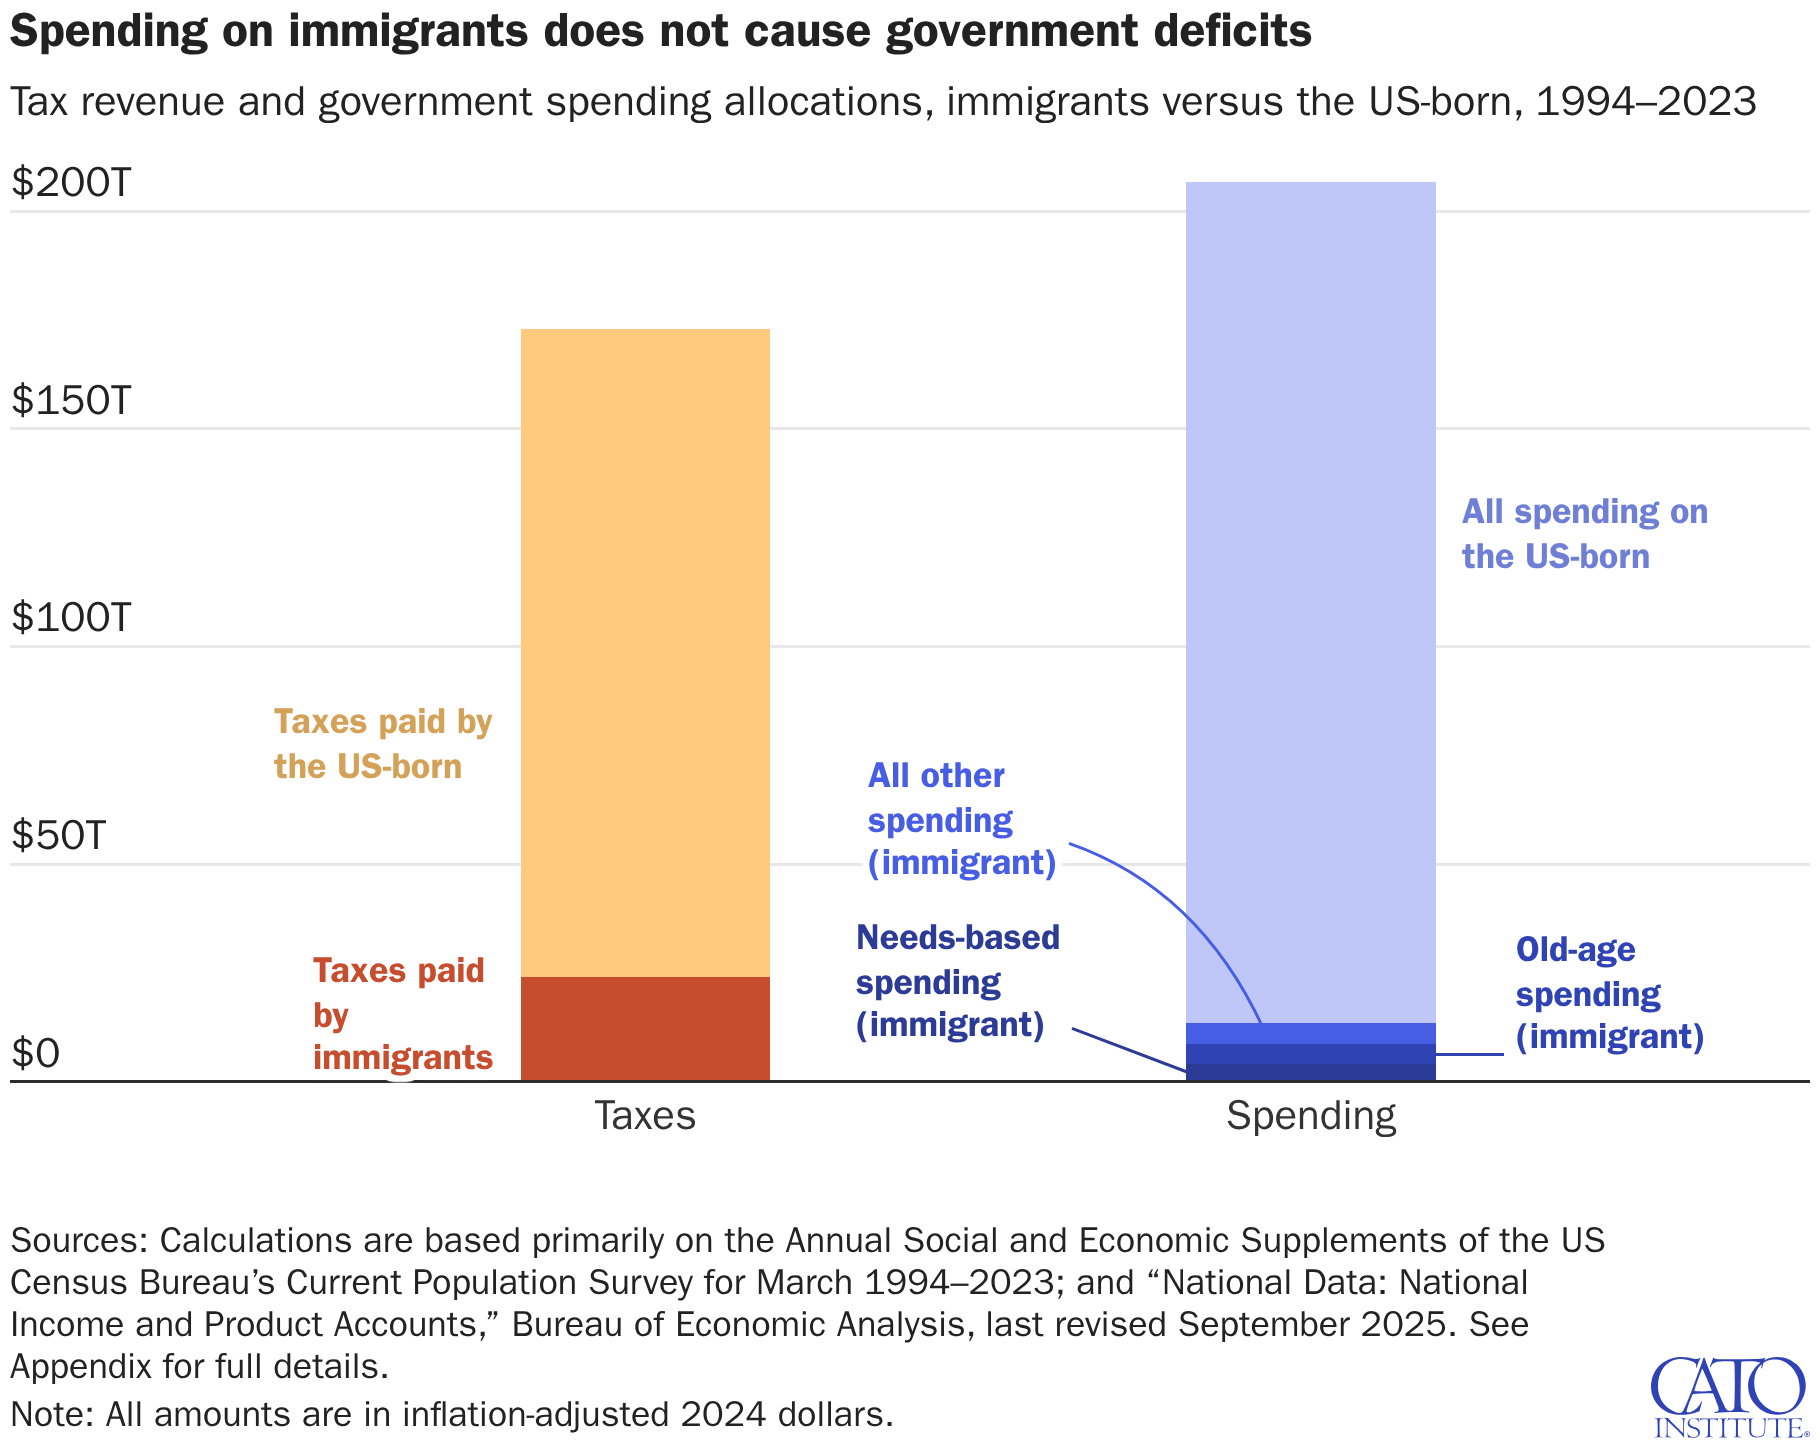
Here’s another way to look at our main conclusion. Immigrants accounted for 14 percent of tax revenue and 7 percent of government spending from 1994 to 2023. Even if the government had not spent a dollar on immigrants, while somehow still getting all their tax revenue, the US government at all levels would still have run a $20 trillion deficit. Immigrants are not to blame for government deficits. Indeed, they reduced the deficit by about $14.5 trillion.
None of this will be a surprise to those of us who actually know and have followed the issue closely.
The government first began gathering detailed information on benefits use by citizenship status in 1994. The data show:
For each year from 1994 to 2023, the US immigrant population generated more in taxes than they received in benefits from all levels of government.
Over that period, immigrants created a cumulative fiscal surplus of $14.5 trillion in real 2024 US dollars, including $3.9 trillion in savings on interest on the debt.
Without immigrants, US government public debt at all levels would be at least 205 percent of gross domestic product (GDP)—nearly twice its 2023 level.
These results, which do not account for any of immigration’s indirect, tax-revenue-boosting effects on economic growth, represent the lower bound of the positive fiscal effects. Even by this conservative analysis, immigrants may have already prevented a fiscal crisis.
To head off those who might think welfare fraud committed by immigrants would reverse these findings, the authors carefully account for any fraud impact. In a nutshell—legitimate and illegitimate welfare benefit expenses are in the numbers.
II.
Speaking of welfare fraud, Phil Gramm and John Early recently published an article highlighting the actual biggest fraud in welfare.
Yet even as our economy has experienced broad-based growth, real federal welfare spending has soared by 765%, more than twice as fast as total federal spending, and now costs $1.4 trillion annually. Were that money simply doled out evenly to the 19.8 million families the government defines as poor, each household would receive more than $70,000 a year.
The source of this dramatic mismatch is a fraud built into how various programs determine welfare eligibility: The government doesn’t count any refundable tax credits or benefits that aren’t paid in cash as income to the recipients.
There are two major components of surprising stats in this article. First is how much uncounted benefits actually flow to those in poverty, which greatly reduces the actual poverty rate. The second is how much less it would take to achieve the same result without all the complexity the current process entails—with poorly aligned incentives creating unintended beneficiaries as well as anti-work incentives among intended beneficiaries not to mention the explicit fraud that expectedly results.
The government’s failure to count its largess as recipients’ income allows welfare households to blow past the income level above which a working family no longer qualifies for government help. Take a single parent with two school-age children who earns $11,000 annually from part-time work. The government considers this household in poverty because its income is below $25,273. But this family would qualify for benefits worth $53,128. It would receive Treasury checks of $3,400 in refundable child tax credits and $4,400 in refundable earned-income tax credits. The family would also receive Food Stamp debit cards worth $9,216 a year, $9,476 in housing subsidies, $877 of government payments for utility bills, $16,033 to fund Medicaid, $3,102 in free meals at school and $6,624 in Temporary Assistance for Needy Families. All this puts the family’s income at $64,128, or 254% of the poverty level.
A hardworking family earning anything like $64,128 in salary wouldn’t be eligible for any of these welfare benefits in four-fifths of the states. Meanwhile, the welfare family would be eligible for another 90 small federal benefits and sundry state and local welfare programs.
According to the Congressional Budget Office and other independent researchers, when all means-tested payments are counted as income, most welfare recipients have incomes that put them in the middle class, and the proportion of poor people in the U.S. falls from more than 10% to less than 1%.
...
If the government simply gave every poor family in America enough money to raise its income above the official poverty level, it would cost only $240 billion. That would reduce the annual deficit by two-thirds.
There are good arguments against switching to a flat benefit payment system like a Basic Income Guarantee (BIG)1 even if we can assume we could achieve a switch rather than an add on to the current mess. However, we should think about the savings as a very meaningful benefit pushing us to consider such a move. Notably it could also remove the benefit cliff problem. Regardless, the difference between where we are and where we could be in terms of actual benefits flowing to those we actually seek to help is enormous.
Magnitude Matters is a reader-supported publication. To receive new posts and support my work, consider becoming a free or paid subscriber.
AKA, a Universal Basic Income (UBI). Theoretically, a UBI or BIG would simply provide every citizen a certain amount of income sending them a check regularly. The idea is simple enough: To make sure everyone’s income is above a minimum level. If ideally executed (yes, a big if…), then it would taper off at some rate so as to minimize the benefit cliff and its corresponding incentive problems. Taper too fast, and the benefit cliff remains. Taper too slow, and the program is massive.